Service Links
Rollbar is not the “last stop” for monitoring and debugging - often you might also be interested in what your other monitoring and performance tools are telling you. Those tools were a few clicks and copy-pastes away - now with Service Links they are just 1 click away.
Creating a Service Link
Configuration is per-project in Rollbar.
- In Rollbar, navigate to Projects and select the project you want to create a Service Link in
- In the left-side navigation, click Service Links→ Create a Service Link
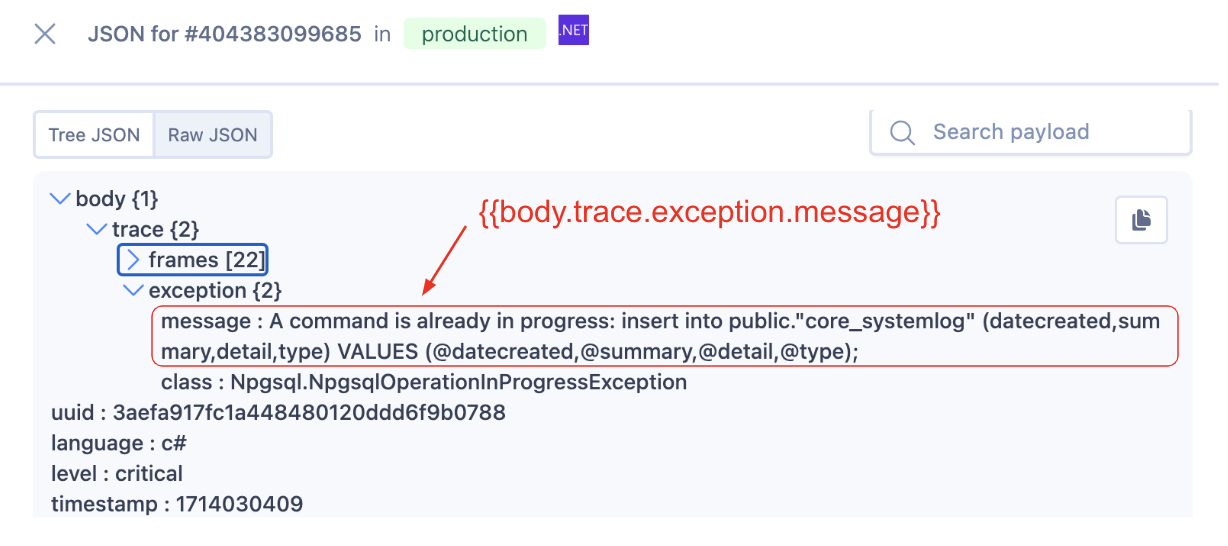
- Create a link in the text area. You can add dynamic payload data to a service link, by using the raw JSON you send to Rollbar. This data is accessible via JSON dot notation - surround the parameters with {{ }}. If you want to access an index in a list of objects, you can do so like this: `my_var.some_list[2]

- Name the link, then click Save
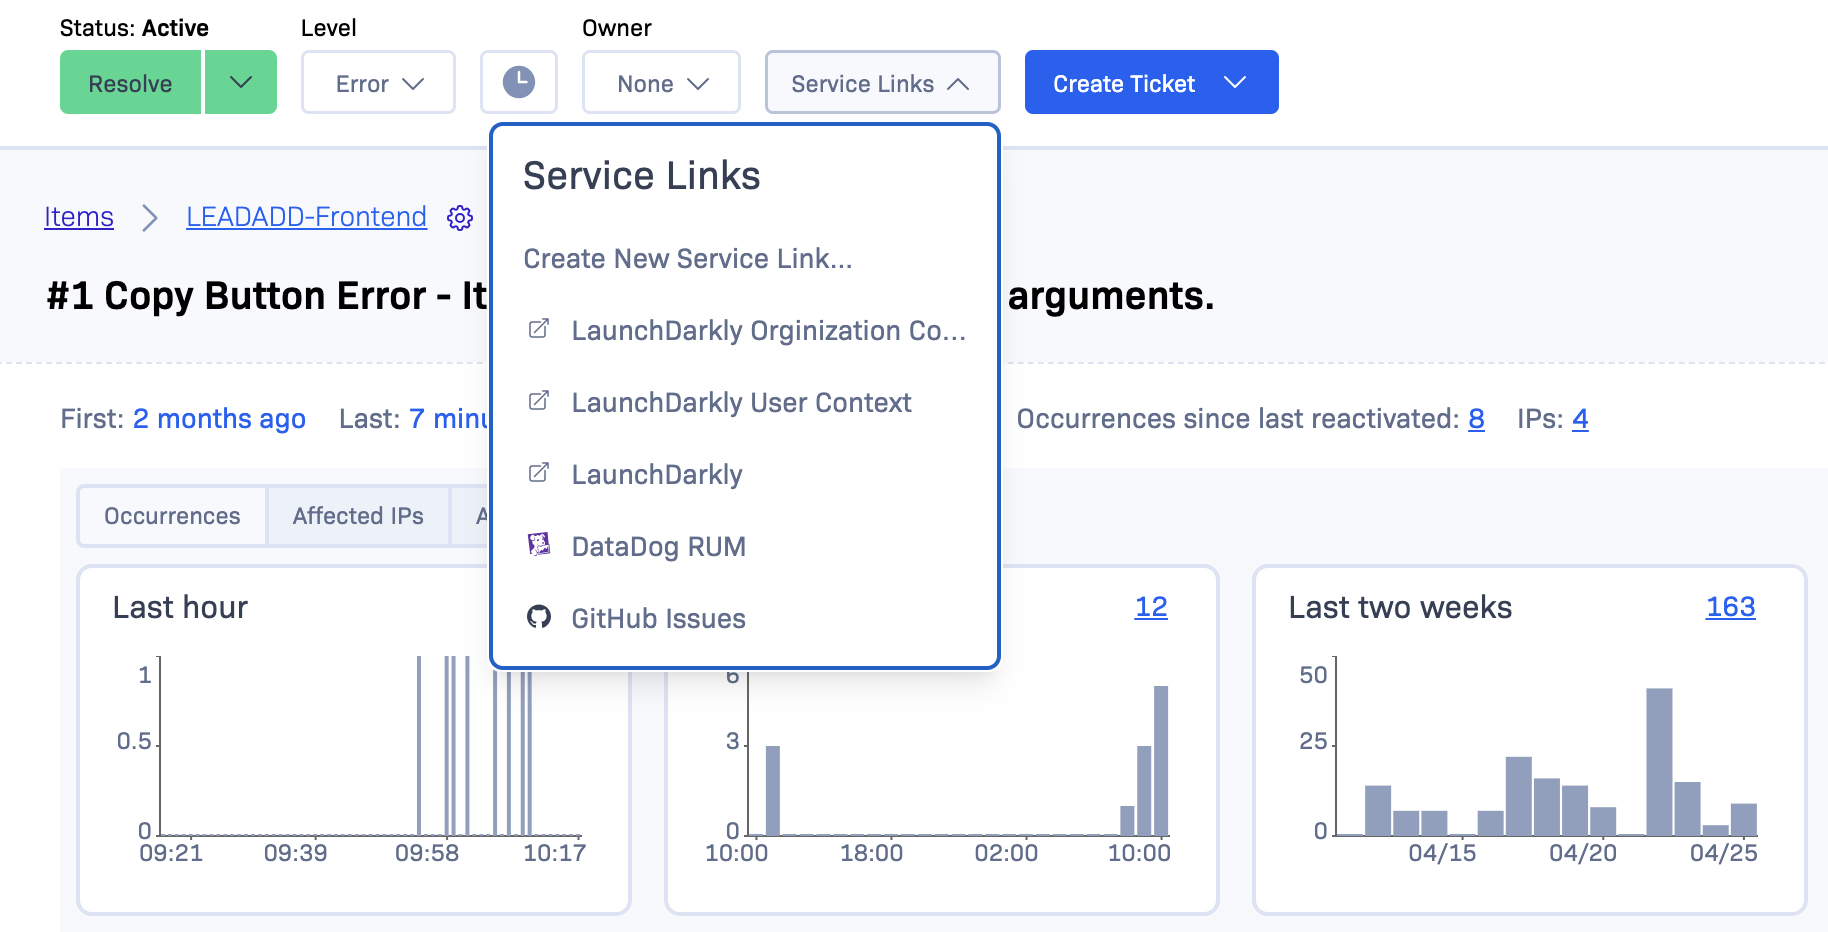
- Service Links will now show up on the item detail page

Account Limits
There is a limit to the number of service links allowed in lower tiered accounts. The limit is as follows:
- Free/Essentials: 1 Service Link per project
- Advanced: 5 Service Links per project
- Enterprise: unlimited
Examples
Open AI
- Have AI debug an error:
https://chat.openai.com/?q=Debug this {{language}} error: {{body.trace_chain[0].exception.message}} in {{environment}} Stack trace: {{body.trace_chain[0].frames}} - Rollbar Debugging Assistant:
https://chatgpt.com/g/g-68f184d34a3481919358376b5dbadf86-rollbar-debugging-assistant/?prompt={{body.trace}}
Datadog
- Search traces for the given request URL:
https://app.datadoghq.com/apm/traces?index=apm-search&live=true&query=%40http.url%3A%22{{request.url}}%22 - Search for recently triggered monitors in the given environment:
https://app.datadoghq.com/monitors/triggered?q=env%3A{{environment}} - Search logs with a source tag supplied from a custom data tag:
https://app.datadoghq.com/logs?query=source%3A{{custom.serviceName}} - Search logs using the server.host value as a k8s pod name:
https://app.datadoghq.com/logs?query=pod_name%3A{{server.host}} - Search for traces using a span ID & trace ID added to the Rollbar occurrence payload:
https://app.datadoghq.com/apm/traces?spanID={{custom.span_id}}&traceID={{custom.trace_id}} - Query the logs for a given person ID:
https://app.datadoghq.com/logs?query=%40current_user%3A{{person.id}}&live=false
Splunk RUM / SignalFX by Splunk
- Find Real User Monitoring Data around the time that a specific error occurred.
https://app.us1.signalfx.com/#/rum/tagspotlight?analyze=page.frontendErrors&endTime={{client.timestamp}}&startTime=-15m&analysisTab=exemplars
Elastic RUM
- Find Real User Monitoring Data around the time that a specific error occurred.
https://YOURINSTANCENAME/app/apm/services/my-service-name/transactions/view?kuery=&rangeFrom=now-15m&rangeTo=now&environment=ENVIRONMENT_ALL&serviceGroup=&comparisonEnabled=true&transactionName={{context}}&transactionType=page-load&offset=1d&score=0×tamp={{timestamp}}
New Relic
- Search New Relic for events related to the New Relic Entity Guid that matches the Rollbar Project
https://one.newrelic.com/nr1-core/open-instrumentation-explorer/summary/<ENTITY_GUID>?account=<ACCOUNT_ID>&begin={{custom.starttime}}&end={{custom.endtime}}
If there is more than one New Relic Entity Guid for your Rollbar project, send the Entity Guid as an additional custom property in the payload
Sumo Logic
- Search across all log sources for the exception description: `https://service.sumologic.com/ui/#/search/create?query={{body.trace.exception.description}}&startTime=-1h
Honeycomb
- Search traces using a trace ID added to the Rollbar occurrence payload:
https://ui.honeycomb.io/<YOUR_ACCOUNT>/datasets/distributed-traces/trace?trace_id={{custom.trace_id}}&trace_start_ts={{timestamp}}
Testrail
- Navigate to the given Testrail session from the session ID:
https://<ACCOUNT>.testrail.io/index.php?/runs/view/{{seleniumsessionid}}
Graylog
- Search for logs with a given request ID:
https://graylog.tools.<ACCOUNT_DOMAIN>/search?q=rid%3A%22{{custom.request_id}}%22&rangetype=relative&relative=604800
Github
- Link to the given commit in your github repo:
https://github.com/<USER>/<REPO>/commit/{{code_version}}
Search for User in Admin
https://yourAdminDomain.com/search?user={{person.email}}https://yourAdminDomain.com/user/{{person.id}}
Google the Exception
https://google.com/search?q={{body.trace.exception.message}}- If your exception is missing, use
{{body.trace_chain[0].exception.message}}
Zendesk Searches
https://yourzendesk.zendesk.com/agent/search/1?q={{person.email}}
LaunchDarkly - See Users Details for an Environment
https://app.launchdarkly.com/default/{{environment}}/context/user/{{person.id}}- View user contexthttps://app.launchdarkly.com/default/{{environment}}/context/organization/{{custom.customerid}}- View organization contexthttps://app.launchdarkly.com/default/{{environment}}/features/- View all flags for this environment.
DevCycle
https://app.devcycle.com/o/<YOUR ORGANIZATION ID>/p/<YOUR ACCOUNT>/features/{{custom.devCycleFeature.id}}- View feature details, if{{custom.devCycleFeature.id}}exists in the error payload to contain id of feature-related errorhttps://app.devcycle.com/o/><YOUR ORGANIZATION ID>/p/<YOUR ACCOUNT>/features- View all features for this accounthttps://app.devcycle.com/o/><YOUR ORGANIZATION ID>/p/<YOUR ACCOUNT>/variables- View all variables for this account
GrowthBook
https://app.growthbook.io/features/{{custom.growthBookFeature.name}}- View feature details, if{{custom.growthBookFeature.name}}exists in the error payload to contain name of feature-related errorhttps://app.growthbook.io/features- View all features for your account
View Other Items in Code Version
https://rollbar.com/your-account/your-project/versions/{{environment}}/{{code_version}}
Logs Based on Timestamp
https://your-logging-tool.com/search?from_timestamp={{timestamp}}&environment={{environment}}
RQL Queries
All occurrences with the same exception message (30 minute range):
https://rollbar.com/your-account/your-project/rql/?q= select * from item_occurrence
where body%2Etrace%2Eexception%2Emessage = "{{body.trace.exception.message}}"
and timestamp > {{client.timestamp}} %2D 1800 and timestamp < {{client.timestamp}}
%2D (%2D1 %2A 1800) limit 100
Same as above, but groups by item number (30 minute range):
https://rollbar.com/your-account/your-project/rql/?q= select item.title, item.counter
from item_occurrence where body%2Etrace%2Eexception%2Emessage = "
{{body.trace.exception.message}}" and timestamp > {{client.timestamp}} %2D 1800 and
timestamp < {{client.timestamp}} %2D (%2D1 %2A 1800)  group by item.counter limit 100
Timestamp Formatting
Service links now support timestamp conversion and basic arithmetic operations for timestamp formatting purposes. This can help you set up query links with custom time ranges that are relative to the timestamp of the given event in Rollbar.
*. https://someservice.com/myapp/logs?timestamp={{format_unix_timestamp("%Y-%m-%d", timestamp)}}
https://someservice.com/myapp/logs?timestamp_min={{format_unix_timestamp("%Y-%m-%d%H:%M:%S", timestamp - 60)}}×tamp_max={{format_unix_timestamp("%Y-%m-%d%H:%M:%S", timestamp + 60)}}
The format_unix_timestamp() method is defined below:
format_unix_timestamp(format_string, unix_timestamp)
format_string: implements a subset of the standard SQL timestamp format elements:
%Y The year with century as a decimal number.
%m The month as a decimal number (01-12).
%d The day of the month as a decimal number (01-31).
%H The hour (24-hour clock) as a decimal number (00-23).
%M The minute as a decimal number (00-59).
%S The second as a decimal number (00-60).
%% A single % character.
unix_timestamp: The timestamp to be formatted, usually `timestamp` from the given Rollbar item is used.
Using AWS Lambda to Reformat Service Links
It may be necessary to reformat the data available in the Rollbar occurrence to create the correct URL. This example below shows an AWS Lambda function being used to redirect to a different URL for different environments
import json

def lambda_handler(event, context):

   # Expects Service Link of the form:
   # https://xxxxx.amazonaws.com/yyyyy?session={{custom.session_id}}&env={{environment}}
   session_id = str(event['queryStringParameters']['session'])
   env = str(event['queryStringParameters']['env'])

   if env == 'production':
       url = 'http://localhost/prod_logs?searchtype=freetext&query={}'.format(session_id)
   elif env == 'qa':
       url = 'http://localhost/qa_logs?searchtype=freetext&query={}'.format(session_id)
   else:
       raise ValueError('Unknown env parameter given in query string')

   response = {}
   response["statusCode"]=301
   response["headers"]={'Location': url}
   data = {}
   response["body"]=json.dumps(data)

   return response
Accessing Item, Occurrence and Project IDs
The following fields can be used to include the item details in the service link url:
- {{item.counter_id}} - the item number (as seen in the item url and at the top of the item page)
- {{item.id}} - the item ID
- {{item.occurrence_id}} - the occurrence ID of the specific occurrence that is open
- {{item.project_id}} - the project ID for the item in question
Troubleshooting
Service link is not appearing
This usually indicates that something is missing from the link. If a data field is referenced in a service link but the data field is not present in the given item, the link will not populate. Double check the occurrence data to ensure the field is present and named correctly, and also check your service link configuration to make sure there are no formatting issues.
NOTE
If the variable you are trying to access in your payload is formatted in ‘dot notation’ like
some_variable.urlyou will need to add ticks around the variable.It should look something like `{{body.extra.’some_variable.url’}}`
Updated 6 months ago