Rollbar as a tool for DevOps Teams
DevOps monitoring & troubleshooting is a complex process. There are many different places where failures can occur, and it is up to you as an engineer to diagnose and address these problems. Fortunately, Rollbar can help DevOps teams by providing better alerting signal and a new starting point for your investigations.
Rollbar is most commonly known for its ability to help developers improve their code quality by reporting errors in real-time and grouping those errors to effectively determine the code culprit of a given issue. However, thanks to features like Automation-Grade Grouping and customizable alerting, Rollbar can also be used to empower other roles such as SREs and DevOps engineers. These features give better visibility into DevOps processes such as the CI/CD pipeline and the operational health of the code.
Use Rollbar as a Starting Point for all Error Investigations
Thanks to Rollbar’s ML-powered grouping engine, alerts can notify your team of errors that have not been previously reported in your code. This intelligent analysis helps keep you informed of new problems as they surface — even if only a small number of users are affected — so that you can proactively be one step ahead.
Rollbar items are tightly coupled to the code that causes these items. Features like Code Context can show you the exact version and line of code where an error originated, as well as the last person to change that code. Therefore, the use of Rollbar alerts as a first line of defense can be a reliable way of discovering problems.
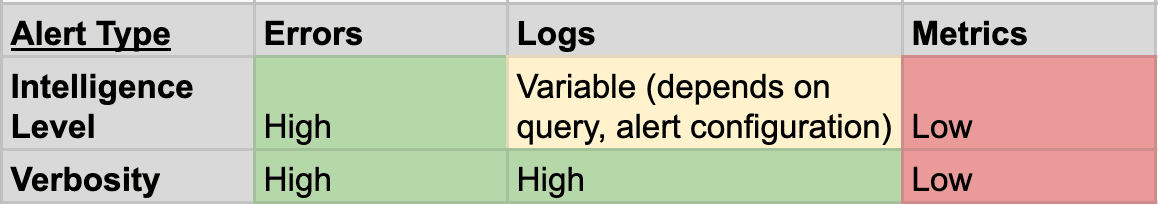
The table above helps to illustrate why Rollbar should be your starting point for investigating issues - the amount of context provided by a Rollbar event is very high, thanks to the verbose nature of the exceptions and the intelligent analysis performed by the grouping engine. This gives a better signal-to-noise ratio, meaning a Rollbar alert is much more likely to indicate a real problem instead of a false alarm.
Once you have been alerted and begin to investigate, the Item detail menu can help to determine if there are any commonalities for the occurrences. Code problems are usually diverse in their impact across operating systems and users, but resource problems are usually grouped together around a single failing resource. For example, if you see that all of an item’s occurrences are being reported from the same host, then you may need to move on to your logging service to investigate the server’s logs.
Identifying, Assigning, and Addressing the Issue at Hand
Errors occur when your code, during execution, encounters unexpected or problematic behavior. They are a way of encapsulating the given problem and preventing it from cascading to bring down your entire application. Since these errors indicate a code failure, it is often the case that the code is also the perpetrator. Rollbar will provide you with the code “coordinates” (line/column number) by default, so you have a clear indicator of the point of failure.
However, you can greatly improve the value of the stack traces & code coordinates by integrating your source control software with your Rollbar projects. By linking the Rollbar project to a given repository and branch, you can see the 5 lines of code before and after the coordinates plus the git blame information showing who made the last change to that portion of the code and when. This allows you to follow up with that developer and decide if they should be the one to fix the problem.
Once you have chosen the person who will address the issue, you can assign that person within the Rollbar domain and/or use the Issue Tracking integrations to persist the new issue. Issue tracking can be configured for manual or automatic ticket creation. Manual ticket creation lets you make the decision whether or not an Item necessitates a ticket. Automatic ticket creation allows you to set ticket creation rules & criteria, similar to the way you configure alerting rules. These rules can also be used to make sure that tickets are properly closed when they are resolved in Rollbar.
Service Links as a Springboard to the Next Solution
Service Links can help you quickly pivot from Rollbar to other tools and services without losing context. Service Links are dynamically constructed links that use the templated fields from your Rollbar items to provide better context. They can be used to link to other observability services with pre-built queries to save time and make sure that your searching criteria are aligned with your Rollbar results.
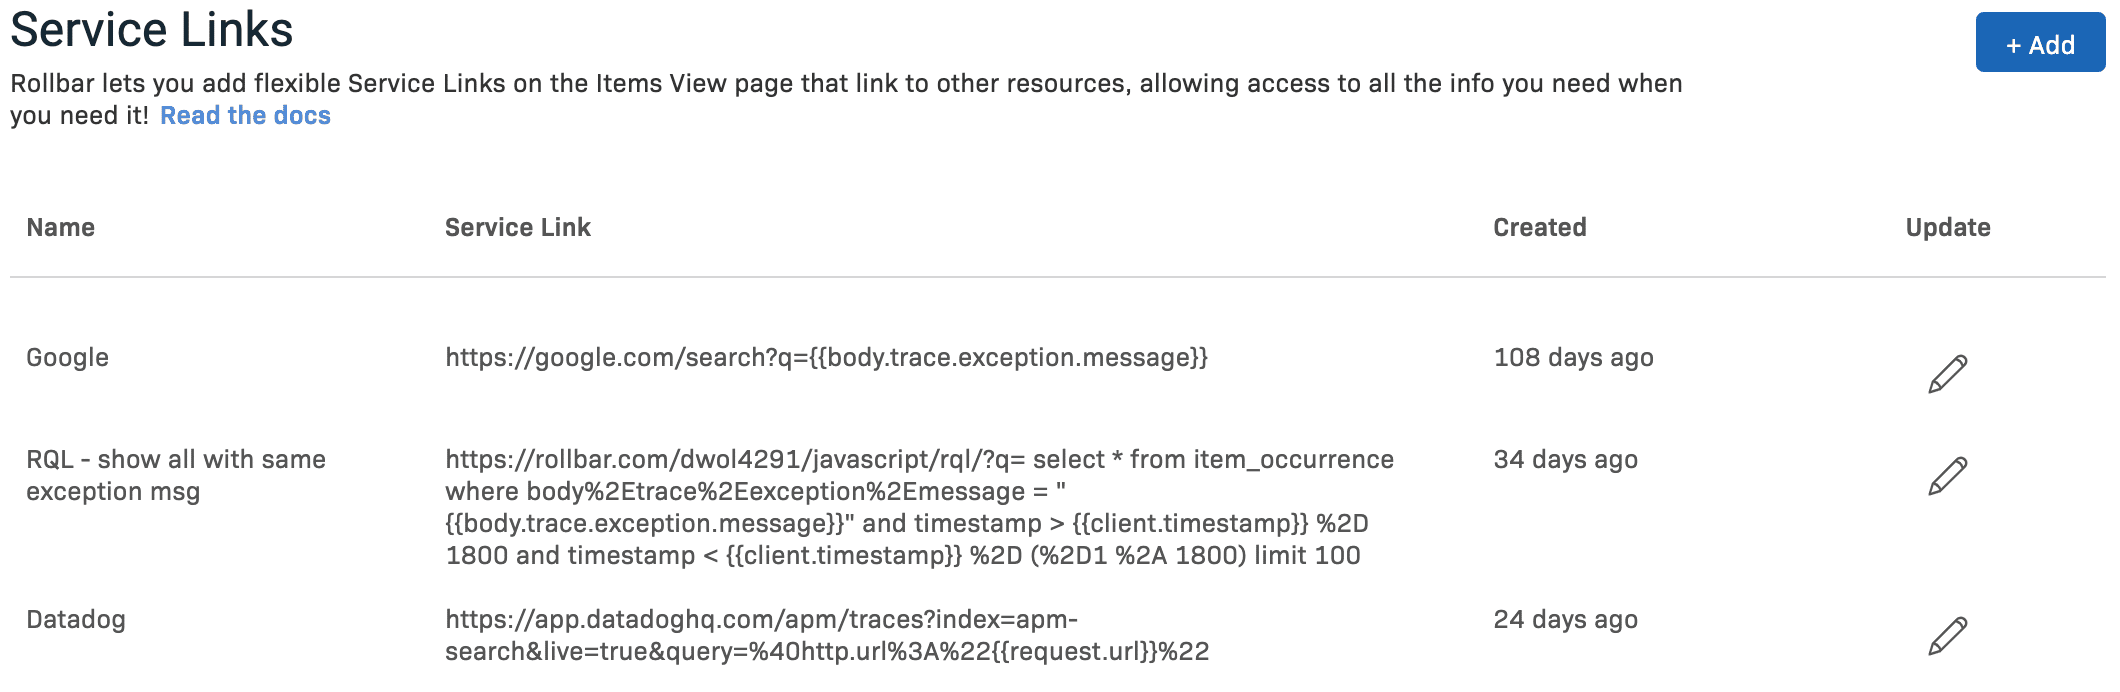
Since they are nothing more than URLs with extra text, Service Links can be used to redirect a Rollbar user from an Item to any service that may be used during the investigation. You can take the host information from the item in question and use that as a search parameter in your log analytics service link. It can be used to link to pre-built RQL queries as well, saving users the time of writing a query from scratch every time they need more data about the item in question.
With all of these features at your disposal, you can easily determine the root cause of the problem at hand and assign the right people to the issue more quickly. Even if Rollbar doesn’t reveal the root of the problem, the information provided by an item can help you with your search by providing context to your other monitoring services. These improvements cascade to the Mean Time to Acknowledgement and Mean Time to Resolution metrics, which helps to deliver a better user experience.