Improve
Rollbar Improve is designed to provide information through easily digestible metrics and historical trends to allow teams to understand their code and take action to improve their practices.
Rollbar securely collects information about your applications through the logging and error reporting process. This unique data provides unique insights into your code health and recent development trends in your organization. Rollbar Improve is designed to provide that information through easily digestible metrics and historical trends to allow teams to understand their code and take action to improve their practices.
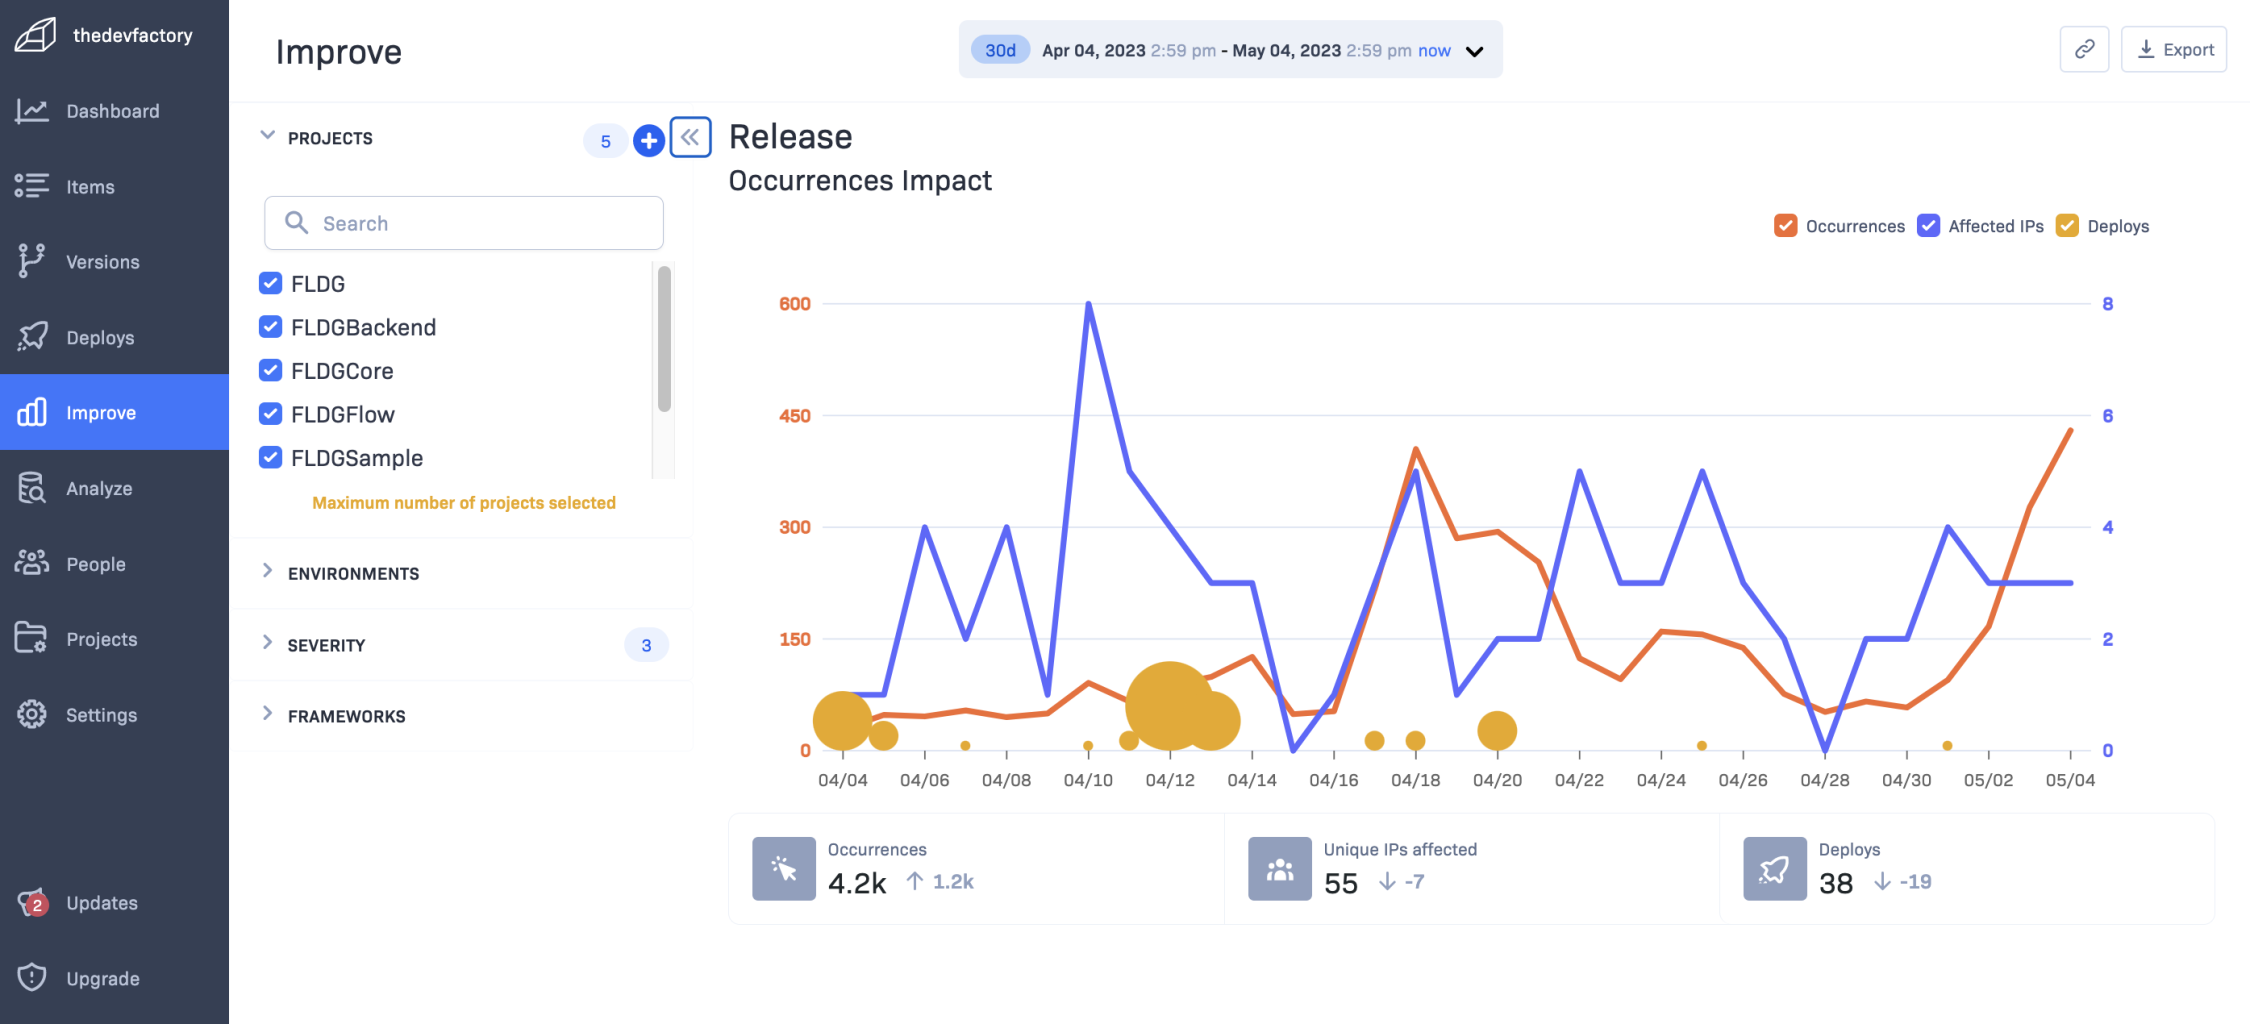
Improve: Release Dashboard
Rollbar Improve has two main components: the Occurrences Impact chart and the Metrics panel below the chart. Both components are dependent on the filters in the left margin as well as the time range selector at the top of the page.
Component Breakdown
Each component will be reviewed below in detail.
Occurrence Impact
This chart has 3 figures: the occurrence volume chart, the IP address impact chart, and the deploy frequency chart.
Occurrence Volume
This chart shows a recent trend of occurrence volume, IP address impact, and deploy frequency. The total number of occurrences for the filtered time range will be time-sliced into daily totals and shown in orange as a line chart. The scale for this chart is on the left.
There is no additional configuration required for this chart, as long as your project is reporting occurrences without rate limiting then your data should be accurate.
IP Address Impact
This chart shows the number of IP addresses impacted by the occurrences reported. The total number of affected IP addresses for the filtered time range will be time-sliced into daily totals, like the occurrence volume, and shown in blue as a line chart. The scale for this chart is on the right.
Make sure that your projects are configured to show the affected IP address to ensure this data is accurate. This is captured by default in most frameworks.
Deploy Frequency
This chart shows the number of deployments made. The number of deploys for the filtered time range will be time-sliced into daily totals and shown with yellow dots along the X axis of the Occurrence Impact chart. Hovering over the dots with your cursor will display the exact number of deploys for a given dot since there is no scale shown for this chart.
Deploy Tracking is not configured by default, since it is not a part of the occurrence reporting process. Check the documentation for your given CI/CD service to enable deploy tracking, otherwise this chart will have data and thus will not render.

Improve: Release Deploy Frequency
Metrics
This view currently has 4 different metrics panels. Each one displays a different figure, plus its comparison against the previous window of time. These metrics are intended to help you understand recent trends in your software's health and performance.
Occurrences
The total number of occurrences for the filtered time range, plus its comparison against the previous time range. This helps you understand the overall error/event rate.
Unique IPs Affected
The number of unique IP addresses affected by the occurrences in the filtered time range. This helps you understand the impact of the occurrences and how many users are affected.
Deploys
The number of deployments made in the filtered time range. This tells you how often your code is being changed and you can see how that is affecting your event rates.
Mean Time to Resolve
The average time for an item in the filtered time range to go from first appearance to being resolved. This tells you how effectively your users are responding to issues.
NOTE: Currently, Mean Time to Resolve includes auto-resolved items. This will affect the metric.
Filters
The left margin includes a list of filters, similar to how the Items menu allows for filtering of the main item list. These filters control which events will be included in the chart and metrics calculations.
Projects
Filter to a single project or a group of projects. This allows you to track the performance of individual microservices and applications independently of their counterparts.
Environments
Select one or more environments to determine how your software is performing in different stages of the SDLC and deployment process.
Severity
Also known as Item "level," the severity is one of 5 different values from least to most severe: Debug, Info, Warning, Error, and Critical. Select one or more of these to determine the severity of events in your filtered time range.
Frameworks
Select one or more frameworks to isolate a given language or framework for deeper analysis. This can help expose points of failure in these given frameworks.
Time Range Selector
This component is at the top of the page, and is used to determine the measured window of time for the chart and metric calculations. There are a number of pre-built selections, as well as a custom date/time range selector.

Clicking on the time range selector will open the dropdown menu with different time range selections.